WORKFORCE / LABOUR FORCE
*All information has been sourced using Statistics Canada: 2016 Census, unless otherwise specified
REGIONAL EMPLOYMENT DATA | |
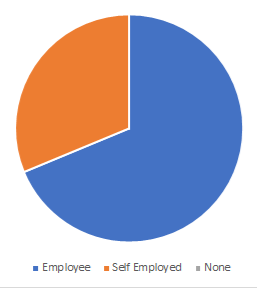
Worker Class | Employed Vs. Unemployed in the Region |
 | 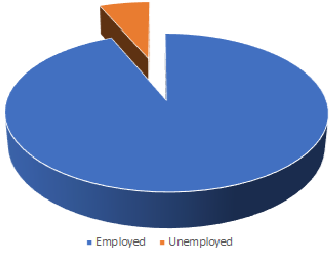 |
Overall, the employment rate in the region is growing at a rate of 0.49% per year over the past 15 years from 2001 to 2016. In the last two census, its employment rates declined by 0.9%, an average decline rate of 0.09% per year from 2006 to 2016.
The unemployment rate in the region is growing at a rate of 0.42% per year over the past 15 years from 2001 to 2016. In the last two census, its unemployment rates grew by 6.3%, an average growth rate of 0.42% per year from 2001 to 2016.
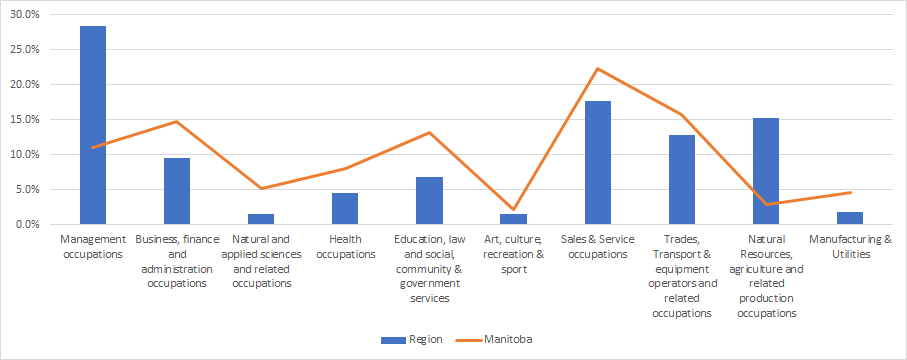
LABOUR FORCE BY OCCUPATION |
The term “jobs” refer to positions located within the region. “Labour” refers to the people who work. For example, a teacher lives in one community yet works in another. The job would be counted in the community where the school is located. The occupation would be counted in the community where the teacher lives.
Another way to identify characteristics of a region is to examine the makeup of occupations within the labour force. Using 2016 data from Statistics Canada, the above figure shows that:
- The largest percentage of workers are in the field of Management occupations (28.4% or 475 people regionally), followed by Sales and service occupations (17.7% or 295 people regionally).
- In Manitoba, the largest percentage of workers are in the field of Sales and service occupations (23.8% or 144,490 people provincially), followed by Trades, transport & equipment operators and related occupations (15.8% or 102,660 people provincially).
- The region has nearly 5 times higher percentage than the average of Manitoba in the field of Natural Resources, agriculture and related production occupations
- The region has over 2 times higher percentage than the average of Manitoba in the field of Management occupations
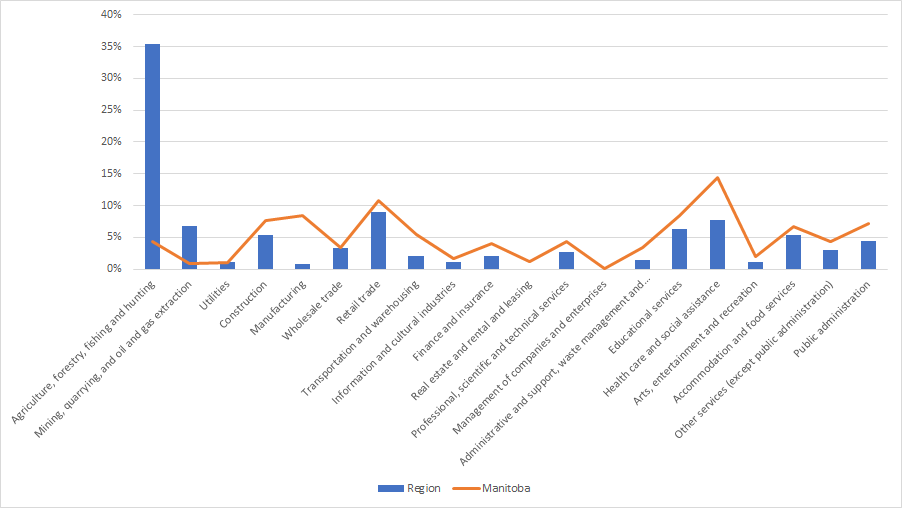
LABOUR FORCE BY INDUSTRY |
The strength and diversity of the labour force can be analyzed by dividing industries into three types:
- The Primary sector – industries that extract and produce raw materials; for example Agriculture.
- The Secondary sector – industries that change raw materials into goods; for example Manufacturing.
- The Tertiary sector – industries that provide goods and services to business and consumers; for example Accounting or Retail.
The Primary and Secondary sectors are referred to as the Goods producing sectors. The Tertiary sector is referred to as the Service sector. Industries and Jobs are classified by the North American Industry Classification System (NAICS). In 2016 there were a total of 1,680 jobs in the region (StatsCan). The above graph shows that:
- 42% of the jobs in the region are in the primary sector of Agriculture, forestry, fishing and hunting.
- 7% of the jobs are in the secondary sectors of Construction, Manufacturing and Utilities.
- 33% of the jobs are in the tertiary sector.
- 18% of the jobs are in sectors traditionally funded by government (Education, Healthcare, and Public administration).